Googling didn't help me much on this topic so I thought it might be worth sharing...regarding labeling background layers for data exported from ArcMap to ArcPad using the ArcPad Data Manager extension ("Get Data for ArcPad" tool) for ArcGIS 10.
The scenario that prompted my discovery was this: I had an ArcMap document that contained the geodatabase feature classes that I needed to check out as well as several supporting layers - parcels, streets, streams, etc. I wanted the streets to be labeled, but did not need to check them out for editing. I labeled the streets within the ArcMap file.
Initially I tried exporting the streets as a background shapefile. However, the labels did not transfer when I opened the exported map file in ArcPad. After a bit of experimenting I discovered that exporting the streets as a background AXF file kept the labels intact. I suppose in retrospect this does make sense, as the AXF files are supposed to be these wonderful all-encompassing databases.
So there you go, if you want to label your background layers in an export for ArcPad, make sure to export them to an AXF file!
Sunday, July 29, 2012

Friday, June 29, 2012
Capturing Button Clicks in ArcObjects
It's been quite a while since I've posted...I've been busily moving myself to North Carolina for a contract position as a GIS Developer with the City of Charlotte. I'm working through a company called Systemtec. Everything is going great and Charlotte is a lot of fun! But with all the commotion involved in moving to a new city, this blog fell to the wayside!
This week, I found something fun in ArcObjects that I thought I should share, as it took a bit of Googling and then some guessing to figure out, so clearly there need to be more posts on the topic! In particular I found it difficult to find an example of this for VB.net in ArcGIS 10 (rather than 8.3 or VBA) - the syntax is a little different.
My goal in doing this was to determine when the user clicked the Merge button on the Editor menu in ArcMap (for context, I am developing an Editor Extension Add-In for ArcMap 10 using VB.net). Because Merge works differently from many of the other tools - a bit of experimentation showed that it didn't trigger the OnCurrentTaskChanged event in the Editor - this proved to be a bit problematic.
A post by Kirk Kuykendall set me in the right direction - use the ICustomizationFilter interface. This allows you to listen for ANY button click (and other things - see the ArcGIS help) and react appropriately. (Note that the button names you'll need are available here.) It's designed to prevent the user from doing things you don't want him to do (e.g., accessing VBA, clicking buttons, using tools, etc.). This is done by setting the result of the function to TRUE - this is one of those tidbits that isn't explicitly stated anywhere that I could see, but a true result from the OnCustomizationEvent function prevents the user from doing whatever it was he was trying to do.
In my case, I didn't want to prevent the user from doing anything, I just wanted to KNOW if he did something. To do this, just return false after executing whatever code you're interested in, and you can detect the button clicks without affecting the usability of the program. Only trick is that apparently only one customization filter can be active at a time, so if you have a bunch of different add-ins/dlls running that each has its own filter, that could be a problem.
So enough of that, here's the code I wrote to capture the user clicking the button:
First, create a NEW class module and put in code like this:
Public Class clsCustomizationFilter
Implements ESRI.ArcGIS.Framework.ICustomizationFilter
Public Function OnCustomizationEvent(custEventType As _
ESRI.ArcGIS.Framework.esriCustomizationEvent, eventCtx As Object) As Boolean _
Implements ESRI.ArcGIS.Framework.ICustomizationFilter.OnCustomizationEvent
If custEventType = ESRI.ArcGIS.Framework.esriCustomizationEvent.esriCEInvokeCommand Then
Dim cmd As ESRI.ArcGIS.Framework.ICommandItem
cmd = TryCast(eventCtx, ESRI.ArcGIS.Framework.ICommandItem)
If cmd.Name = "Editor_Merge" Then
ImperviousEditorExtension.g_blnDeleteOK = True
End If
End If
Return False
End Function
End Class
The line ImperviousEditorExtension.g_blnDeleteOK = True is where you would put whatever code you want to have run as a result of the button click. The "Editor_Merge" name can be replaced with the name (from the link above) of any button you want to monitor. Note the key "Return False" at the end - including this means that you don't stop the user from completing the merge or whatever else he wants to do. (If for whatever reason you wanted to stop him from doing something, write a condition to check and within that condition Return True.)
To activate this class, take two steps. First, assuming you're doing this in an editor extension, in the editor extension class create a global variable:
Public Shared m_Filter As ESRI.ArcGIS.Framework.ICustomizationFilter
(if you're not using an editor extension, put this in whatever root module you have)
Second, put this code somewhere that makes sense:
m_Filter = New clsCustomizationFilter
My.ArcMap.Application.LockCustomization("password", m_Filter)
For example, I included it in my OnStartEditing event handler.
Now, to keep things neat and tidy, I unlocked the customization once I was done, so I included the following line in my OnStopEditing event handler:
My.ArcMap.Application.UnlockCustomization("password")
There you go! A method to detect the user's button click on any button in the interface. Hope it helps you as much as it did me!!
This week, I found something fun in ArcObjects that I thought I should share, as it took a bit of Googling and then some guessing to figure out, so clearly there need to be more posts on the topic! In particular I found it difficult to find an example of this for VB.net in ArcGIS 10 (rather than 8.3 or VBA) - the syntax is a little different.
My goal in doing this was to determine when the user clicked the Merge button on the Editor menu in ArcMap (for context, I am developing an Editor Extension Add-In for ArcMap 10 using VB.net). Because Merge works differently from many of the other tools - a bit of experimentation showed that it didn't trigger the OnCurrentTaskChanged event in the Editor - this proved to be a bit problematic.
A post by Kirk Kuykendall set me in the right direction - use the ICustomizationFilter interface. This allows you to listen for ANY button click (and other things - see the ArcGIS help) and react appropriately. (Note that the button names you'll need are available here.) It's designed to prevent the user from doing things you don't want him to do (e.g., accessing VBA, clicking buttons, using tools, etc.). This is done by setting the result of the function to TRUE - this is one of those tidbits that isn't explicitly stated anywhere that I could see, but a true result from the OnCustomizationEvent function prevents the user from doing whatever it was he was trying to do.
In my case, I didn't want to prevent the user from doing anything, I just wanted to KNOW if he did something. To do this, just return false after executing whatever code you're interested in, and you can detect the button clicks without affecting the usability of the program. Only trick is that apparently only one customization filter can be active at a time, so if you have a bunch of different add-ins/dlls running that each has its own filter, that could be a problem.
So enough of that, here's the code I wrote to capture the user clicking the button:
First, create a NEW class module and put in code like this:
Public Class clsCustomizationFilter
Implements ESRI.ArcGIS.Framework.ICustomizationFilter
Public Function OnCustomizationEvent(custEventType As _
ESRI.ArcGIS.Framework.esriCustomizationEvent, eventCtx As Object) As Boolean _
Implements ESRI.ArcGIS.Framework.ICustomizationFilter.OnCustomizationEvent
If custEventType = ESRI.ArcGIS.Framework.esriCustomizationEvent.esriCEInvokeCommand Then
Dim cmd As ESRI.ArcGIS.Framework.ICommandItem
cmd = TryCast(eventCtx, ESRI.ArcGIS.Framework.ICommandItem)
If cmd.Name = "Editor_Merge" Then
ImperviousEditorExtension.g_blnDeleteOK = True
End If
End If
Return False
End Function
End Class
The line ImperviousEditorExtension.g_blnDeleteOK = True is where you would put whatever code you want to have run as a result of the button click. The "Editor_Merge" name can be replaced with the name (from the link above) of any button you want to monitor. Note the key "Return False" at the end - including this means that you don't stop the user from completing the merge or whatever else he wants to do. (If for whatever reason you wanted to stop him from doing something, write a condition to check and within that condition Return True.)
To activate this class, take two steps. First, assuming you're doing this in an editor extension, in the editor extension class create a global variable:
Public Shared m_Filter As ESRI.ArcGIS.Framework.ICustomizationFilter
(if you're not using an editor extension, put this in whatever root module you have)
Second, put this code somewhere that makes sense:
m_Filter = New clsCustomizationFilter
My.ArcMap.Application.LockCustomization("password", m_Filter)
For example, I included it in my OnStartEditing event handler.
Now, to keep things neat and tidy, I unlocked the customization once I was done, so I included the following line in my OnStopEditing event handler:
My.ArcMap.Application.UnlockCustomization("password")
There you go! A method to detect the user's button click on any button in the interface. Hope it helps you as much as it did me!!
Friday, December 16, 2011
Working out kinks in VB.net/BASINS
I mentioned last week that I was working on revising a portion of the BASINS source code to reproduce the statistics and advice previously calculated by the antiquated HSPEXP program. I'm happy to report that I've gotten the portion of the code I was working with up and running, producing area summaries, statistics, and graphs using Virginia Tech's standard formatting, in a new(ish) program that just runs the statistics and does not require BASINS to be launched. Getting the portion of the code up and running took a little time but was not complicated, after addressing the issues in my last post. However, creating a setup file that would run on Windows 7 proved to be a little more challenging, and I thought I'd write about it to help both future BASINS coders and general VB.net coders alike.
My first problem was that the code I'm working with requires an old DLL created (I think) using FORTRAN - hass_ent.dll. I had tried to enter the version of the DLL published with EPA's version of BASINS 4 into the registry on a Windows 7 machine - no luck. Additionally, the version of BASINS available from EPA would not install on a Windows 7 machine. I believe I mentioned in my last post that Aqua Terra has released an updated version of BASINS on their website, which is nearly impossible to find if you don't know what you're looking for. So I tried downloading and installing the "Installer for GenSCN and WDMUtil" available at that website (following the 'keep it simple stupid' mentality, I decided to try installing just what I needed - WDMUtil and HSPF - rather than the full-blown package). Ta-da! It installed. The version of HSPF in that package does not run, but WDMUtil does. The full blown BASINS upgrade includes a newer version of HSPF (3.0), my hunch is that it will run on Windows 7...but again, keeping it simple, I haven't messed with that yet. All I needed for my purposes was to get something to install hass_ent.dll, and the GenSCN and WDMUtil installer was successful for that purpose.
My next problem arose from the fact that I had updated the references for the BASINS source code in a rather patchwork fashion...first I tried downloading DLLs from MapWindow, then I realized several of the needed files were actually available with the BASINS installation available from EPA and just copied the ones I needed, and then when I was still having trouble I upgraded my BASINS installation as above and referenced those DLLs...so depending on when I brought which projects into my VB.net solution, projects using the 'same' DLL might actually reference two different files. Additionally, there was a BASINS project available that compiled into MapWinUtility.dll that was slightly different from the MapWinUtility.dll that seems to be the default for MapWindow, and of course my patchwork solution was referencing both of them. Once I finally got the code to compile after all the various downloads and updates I didn't think to check that all 15 of the member projects were referencing the same DLLs.
I was receiving multiple errors as a result of this. Additionally, once I attempted to publish the file, I got an actual error in Visual Basic 2010 Express that would no longer let me compile the project. These errors were "two or more files have the same target path" within the development environment and "reference in the manifest does not match the identity of the downloaded assembly" while attempting to install the code on a new computer. I had an earlier error "must be strong signed in order to be marked as a prerequisite" that had caused me to change the status of stdole.dll from 'prerequisite' to 'include' in the Publish->Application files screen for my main project (note that the file it said needed to be strong signed was NOT stdole.dll...but fixing that one fixed the error). I think that change might have launched the other errors... At any rate, after googling and googling I finally started checking the references and discovered I had several with the same name pointing to different actual files. I changed the same-named references in all the projects to point to the same DLLs and poof! my errors vanished.
I suppose this is no great surprise - kind of a 'well, duh' kind of moment. I agree. However, I think it is an easy mistake to make with code acquired WITHOUT all the required references, code that forces you to go identify and download all those references yourself. I had googled and tried things for hours before thinking to check my individual project references, so I'm suggesting it here in hopes it may save someone else a lot of wasted time!
Friday, December 9, 2011
Working with Open Source BASINS
This week I've started tackling a fun new project - working with portions of the open source BASINS software. It has been challenging and educational. I've learned a bit about MapWindow and I've also seen that the code needed to access WDM files is really not so bad.
I started on this project because my colleagues at Virginia Tech need a new way to calculate hydrology calibration statistics. We've been using HSPEXP for years, and it does just what we want, but it just doesn't work on modern computers. You can coax it along using XPMode in Windows 7, but even then it has a tendency to randomly freeze up. It's just not happy anymore, and it's time we laid it to rest.
So, fortunately for us, a former graduate student who used to work with me when I worked at Virginia Tech now works for Aqua Terra, the company that maintains BASINS and HSPF. He told us that they've been working on a way to calculate the same statistics that HSPEXP calculates - without the old DOS program and interface.
Fortunately BASINS is open source, so I could get my hands on the code early and customize it for our use. However, things started to get complicated quickly. The folks at Aqua Terra directed me to the subversion download site for BASINS, from which I obtained the code. Fortunately it's written in VB.net, with which I'm quite familiar! However, I quickly learned I needed far more than just the BASINS code.
I discovered that I needed to download several MapWindow projects as well - specifically D4EM, MapWinUtility, and SwatObject. I read a bit more about MapWindow while searching through their site and I must say I find it very exciting - an open source GIS platform for which you can write code in VB.net. I am really interested in developing some GIS programs with the MapWindow libraries, and hope to get in to that once this current project is done.
I also updated my BASINS 4 installation - I'm still not entirely sure if this was necessary, but it I think perhaps it provided the most current version of some DLLs. Some method of BASINS installation is needed to provide hspfmsg.mdb and hspfmsg.wdm. Interesting to note that the update I linked is for 9/2011...which is newer than the current version available on the EPA website, dated 5/2010. Most of the DLLs provided by the BASINS installation can be obtained from MapWindow, but I think the hspfmsg files and a couple DLLs like TableEditor are only available with BASINS. As of the 5/2010 revision, BASINS would not install in Windows 7 except under XPMode. I'm hoping that perhaps if I copy the hspfmsg files to a new computer and get the DLLs from MapWindow I won't have to install BASINS on a Windows 7 computer...this remains to be tested. It is also possible that the 9/2011 version of BASINS will install under Windows 7...this also remains to be tested.
So for now I'm working with the BASINS code on Windows Vista. I ended up just extracting the tool I needed, as in the end we're hoping to have a standalone executable that just calculates the statistics - and maybe runs HSPF - rather than having to launch the full-blown BASINS system. So far I've gotten the statistics calculated, but I still need to work on some connections for the graphs and summary reports, as they're not printing out correctly with the code I've extracted so far. Once everything seems to be working on Vista (where BASINS does install), I'll try transferring everything to a Windows 7 machine and tackle the problems that are sure to arise. I'll let you know how that goes!
Friday, December 2, 2011
Happy Thanksgiving!
Ok, so I know it's a little late, but Happy Thanksgiving! I spent the week in Pittsford, NY visiting my sister at her new house there. Pittsford is a very nice-looking village that borders on the Erie Canal.
Speaking of canals, I just submitted an abstract for the 2012 ASABE international meeting in Dallas, TX. I'm hoping to present the results of my PhD research on modeling for inland navigational canals. I should have done this last year, but my work on the BP Oil Spill kept me too busy to think about anything else during the submission window. As I work on the paper for the conference, I'll also be working on a final journal article for my research.
With the past holiday week, I haven't done much blog-worthy technical work, so I guess that's all for now!
Friday, November 11, 2011
ESRI Shapefiles and Google Maps
This week I discovered something so neat that I just have to share. I've known for quite a while how to export KMZ files from ArcMap for use in Google Earth. This is neat, but from a public participation point of view has the downside that the person who is receiving the map must also have Google Earth installed. It is free, but individuals may be reluctant to install additional software - or unable to install additional software if their company does not give them administrative permissions on their computers. The individual must also understand how to use Google Earth, and to be quite honest it can be a bit slow to load with all the satellite imagery.
While looking at Google Earth this week, I also noticed that it was possible to export content for use in Google Maps. So I fiddled around with things until I figured out how to do it. Here's an example of a finished product (I'll give you step by step instructions in a second). The great thing about presenting maps this way is that you can just distribute a link via email to anyone you want to look at the map - and those individuals can in turn forward the email with a link to anyone (no forwarding of attachments required). Furthermore, the individual only needs to have a web browser installed on his or her machine to view the map - it is a fair bet that just about anyone with email capabilities also has a web browser. Then the recipient can zoom in and out in Google maps just as always - with the information you've sent them hovering over everything.
Creating those maps for distribution is a bit more complicated than using them, and I'd like to describe the steps here in case you'd like to do it yourself. This does require you to have ESRI's ArcMap installed, but if you have another GIS program that can export KMZ files, you can pick up the steps at that point.
Within ESRI's ArcMap version 10:
1. Add the shapefile(s) you'd like to view in Google Maps to an active map document (File --> Add Data --> Add Data...).
2. Customize the appearance of your shapefiles by right-clicking on the shapefile name in the Table of Contents panel and selecting Properties.... In the Properties window, click the Symbology tab and customize the look of your shapefile. IMPORTANT NOTE: THE FILE WILL APPEAR IN GOOGLE MAPS WITH THE SYMBOLOGY YOU SPECIFY. This means that if you display different colors for different polygons, they will be those same different colors in Google Maps, and will appear in a legend on the left pane of Google maps. This also means that if you want to be able to see the contents of Google Maps under your shapefile, you should make the interior of any polygons transparent!
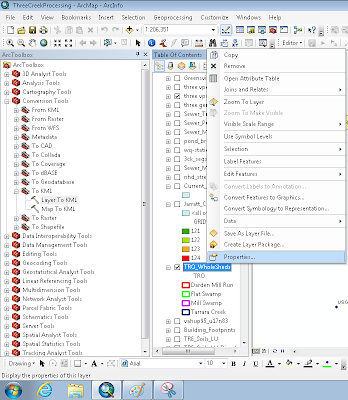
ArcMap Screenshot showing Properties and the Expanded Toolbox (next step)
3. Open ArcToolbox (Geoprocessing --> ArcToolbox) and expand the Conversion Tools heading. Expand the 'To KML' option and double click Layer To KML.
4. In the dialog that appears, under 'Layer' select the layer you want to export. Save it to a useful location you'll be able to find after saving it. Make the 'Layer Output Scale' 1.
Within Google Maps:
1. Go to maps.google.com. If you are already signed in to your Google account, great - if not, click the 'Sign In' link in the upper right corner. You MUST have a Google account of some sort in order to do this.
2. Click the My Places link in the left panel:

3. Click the red 'Create Map' button in the left panel.
4. In the fields that appear, give your map a title and description. Choose the appropriate radio button to indicate whether you want this map Public or Unlisted. Personally I like things I create to go to only my intended audience, so I usually choose Unlisted. Click the Save button if it has not already autosaved.
5. Click the Import link above the Title field.

6. In the dialog that appears, browse and find the KMZ file you exported previously from ArcMap.
7. Poof! You have a map! Click the 'Done' button at the top of the panel.
8. Now for the tricky part...there is probably an easier way to do this, but I haven't discovered it yet. To get the link to share with people, first click on the 'My Places' button at the top of the left panel. Then right-click on the map you just created and select 'Copy Shortcut' - this will copy the link to that map to your clipboard, and you can now paste it into an email or wherever else you choose.
I hope you've found this informative and as exciting as I have! Happy Mapping!
Friday, November 4, 2011
A Low Flow Conundrum - Part 2
So, building on last week's post...I'm currently dealing with a swampy area in southeastern Virginia - this is the first time I've modeled swampy/marshy areas. I took advantage of HSPF's high water table routines - new in version 12.2 of the model - to simulate these areas. Arriving at parameter values was an interesting experience, perhaps something to be discussed in a future post...a student working in the TMDL group at Virginia Tech is delving further into the sensitivity of these high water table parameters for his master's research.
One of the first oddities that struck me occurred when I generated the function tables for these watersheds. Ever since earlier research in the group demonstrated that the function table, as long as it is somewhat sound, has little effect on the overall hydrology predicted by HSPF, we have tended toward using an automated method to generate function tables based on the Natural Resources Conservation Service's hydraulic geometry curves and Digital Elevation Model (NED) information. It is preferable to gather one cross-section per modeled subwatershed, but in cases like the current one, where we have 78 subwatersheds to study, it becomes extremely costly to collect so many profiles.
So, moving forward with the NRCS data for the coastal plain region in Virginia, I noticed that the combination of bankfull depth, top width, and cross-sectional area did not yield a typical trapezoidal cross-section. Normally I use these three estimates to come up with a bottom width for the channel by assuming a trapezoidal channel geometry, but the calculations in this case yield a bottom width slightly larger than the top width. This didn't initially raise any flags for me, I made a mental note of the oddity and simply set the bottom width equal to the top width and moved on.
Unfortunately the studied streams did not have hydrology gauges, so I was unable to compare modeled hydrology with anything observed. We used a 'surrogate watershed' (that already had a TMDL completed) for which the function tables were calculated by another consulting firm (the methodology they used is not evident from the files they provided). During water quality calibration, I noticed that the streams went dry - a lot. This made no logical sense as we know the area we're studying is swampy. Further investigation showed that the free water surface evaporation from the reaches, nothing I had ever given much thought to before, was exceedingly high for the model of these watersheds. I traced the reason back to the difficulty in calculating bottom width - normally the bottom width is considerably smaller than the top width, so that while the flow is in the range of dry stream to bankfull (where it commonly stays), the surface area of the stream decreases as the water level falls, and evaporation decreases accordingly. Because I had set the bottom width equal to the top width for these swampy areas, evaporation continued at a high rate down to the last drop of water, causing the streams to go dry much faster than they should.
To solve this problem, I investigated the function tables from the surrogate watershed and adjusted ours to match their overall pattern. This involved a decrease in the surface area at near-zero flows - which makes logical sense, as when the flow is very small the water will start to move in small streams rather than spreading out across the full flat streambed. This solved the problem for 3 of the 4 study areas. In the fourth, however, it actually caused more problems. This goes back to what I mentioned previously about dealing with low flow issues - that is, setting a cutoff. When evaporation was high, the stream spent a considerable fraction of its time beneath the cutoff stages used for livestock and wildlife. That is, their contributions were removed from the stream a considerable amount of the time. When evaporation was set at a more reasonable level, the stream spent much more time above the cutoff, causing higher contributions from livestock and wildlife and thus increasing the various statistics we use to evaluate water quality calibrations.
This is a very interesting conundrum. Typically increasing flow (done in this case by decreasing evaporation) causes a decrease in bacteria concentrations (the old axiom "the solution to pollution is dilution" - outdated as we know it to be - comes to mind). This is the first time I've seen it actually INCREASE bacteria concentrations - and it is of course due to the way we use the stage cutoff to represent behavioral changes in animals.
I have used the neighboring watersheds as guides to help me set some reasonable parameters for this troublesome watershed. I am finishing up the modeling now and we'll see how well things go!
One of the first oddities that struck me occurred when I generated the function tables for these watersheds. Ever since earlier research in the group demonstrated that the function table, as long as it is somewhat sound, has little effect on the overall hydrology predicted by HSPF, we have tended toward using an automated method to generate function tables based on the Natural Resources Conservation Service's hydraulic geometry curves and Digital Elevation Model (NED) information. It is preferable to gather one cross-section per modeled subwatershed, but in cases like the current one, where we have 78 subwatersheds to study, it becomes extremely costly to collect so many profiles.
So, moving forward with the NRCS data for the coastal plain region in Virginia, I noticed that the combination of bankfull depth, top width, and cross-sectional area did not yield a typical trapezoidal cross-section. Normally I use these three estimates to come up with a bottom width for the channel by assuming a trapezoidal channel geometry, but the calculations in this case yield a bottom width slightly larger than the top width. This didn't initially raise any flags for me, I made a mental note of the oddity and simply set the bottom width equal to the top width and moved on.
Unfortunately the studied streams did not have hydrology gauges, so I was unable to compare modeled hydrology with anything observed. We used a 'surrogate watershed' (that already had a TMDL completed) for which the function tables were calculated by another consulting firm (the methodology they used is not evident from the files they provided). During water quality calibration, I noticed that the streams went dry - a lot. This made no logical sense as we know the area we're studying is swampy. Further investigation showed that the free water surface evaporation from the reaches, nothing I had ever given much thought to before, was exceedingly high for the model of these watersheds. I traced the reason back to the difficulty in calculating bottom width - normally the bottom width is considerably smaller than the top width, so that while the flow is in the range of dry stream to bankfull (where it commonly stays), the surface area of the stream decreases as the water level falls, and evaporation decreases accordingly. Because I had set the bottom width equal to the top width for these swampy areas, evaporation continued at a high rate down to the last drop of water, causing the streams to go dry much faster than they should.
To solve this problem, I investigated the function tables from the surrogate watershed and adjusted ours to match their overall pattern. This involved a decrease in the surface area at near-zero flows - which makes logical sense, as when the flow is very small the water will start to move in small streams rather than spreading out across the full flat streambed. This solved the problem for 3 of the 4 study areas. In the fourth, however, it actually caused more problems. This goes back to what I mentioned previously about dealing with low flow issues - that is, setting a cutoff. When evaporation was high, the stream spent a considerable fraction of its time beneath the cutoff stages used for livestock and wildlife. That is, their contributions were removed from the stream a considerable amount of the time. When evaporation was set at a more reasonable level, the stream spent much more time above the cutoff, causing higher contributions from livestock and wildlife and thus increasing the various statistics we use to evaluate water quality calibrations.
This is a very interesting conundrum. Typically increasing flow (done in this case by decreasing evaporation) causes a decrease in bacteria concentrations (the old axiom "the solution to pollution is dilution" - outdated as we know it to be - comes to mind). This is the first time I've seen it actually INCREASE bacteria concentrations - and it is of course due to the way we use the stage cutoff to represent behavioral changes in animals.
I have used the neighboring watersheds as guides to help me set some reasonable parameters for this troublesome watershed. I am finishing up the modeling now and we'll see how well things go!

Subscribe to:
Posts (Atom)