Beginning with the Mossy Creek and Long Glade Run TMDLs, completed back in...eesh, 2004!...my colleagues and I at Virginia Tech started considering the effects of low flows on physical and behavioral changes in the stream. We noticed at that time that very low flows (Long Glade Run in particular was observed to go dry on a regular basis) cause HSPF to simulate hyper-concentrated bacteria - I typically explain this to my students as HSPF simulating flow happening down to the last little molecule of water hopping down the stream, and trying to cram millions of bacteria into that molecule. Of course in this case the concerns are with direct discharges to the stream from animals standing in the stream and illegal discharges from residences, as overland flow contributions won't be an issue at low flows (they only occur during the high flows associated with storm events) and permitted point source discharges come in with a significant volume of water that tends to prevent low flows.
The reason this happens is that HSPF simulates the stream using a function table (FTABLE) to represent the hydraulic properties of a reach. This FTABLE includes columns for depth, surface area, volume, and discharge, and HSPF enters the table for a given volume to interpolate the other three properties. As a result, the entries in the FTABLE create a series of smooth-sided stacked trapezoids. The lowest entry in the FTABLE is required to be zero volume, so HSPF will continue to interpolate flows all the way down to zero volume in the stream.
Clearly this is problematic. The first, physical, issue is that the stream bottom is not smooth - it is rough - and there is a period of time when there is still water (volume) in the reach but there is no flow, when the water is stored in a series of disconnected pools. This means from a modeling point of view that there is water, and direct discharges into that water can occur, but they will not flow downstream. Imagine a cow standing in the puddles, defecating - the cow pie will certainly contribute a large volume of bacteria to the puddle it hits, but because the puddle doesn't connect to any other puddles, the bacteria do not have the opportunity to move downstream. Additionally, the bacteria will have time to die off before the stream flow returns to a normal level. To address this physical situation, we began adding what we called a 'flow stagnation volume' to the reach - an entry in the FTABLE, immediately after the required zero flow entry, that has a small volume but no discharge. This allows the model to appropriately simulate cessation of flow when the volume falls to a level when all water is actually in a series of disconnected pools. The water and bacteria are not lost, simply held until flow increases. This will appropriately affect ALL sources of bacteria.
The second issue is a little harder to describe mathematically. This issue is a behavioral one and is twofold. First, if the water in the stream is running in a narrow rivulet, where before cows might have stood in the stream for relief from heat, insects, etc. and had their hind ends over the water, now the stream will provide little relief from heat and pests and will be a much smaller target for the defecated material to hit. This means that at some point the cows may still drink from the stream, but it is much less likely that their manure will actually be deposited in the stream. The same could be said of wildlife, though perhaps the restrictive depth would be lower because the animals are smaller. The second issue has to do with the water availability. If there is indeed an intermittent stream in a farmer's field, a logical assumption is that he must provide an alternative water source to the livestock when the stream goes dry or nearly dry. There is a lot of anecdotal evidence and some research literature to suggest that cows with alternative water sources will spend as much as 90% less time in and around the stream. Thus, if the water is low and we assume at those times the farmer must provide another water source, we can assume that the cows will be physically removed from the stream. In a similar manner, if the stream is getting low, it stands to reason that highly mobile wildlife (e.g., waterfowl, which also happen to be the worst offenders in terms of defecating in the stream) will fly away to wetter areas, again physically removing themselves from the stream.
To address this second complex behavioral issue, we institute a "stage cutoff" on animal contributions to the stream. This means in a practical sense that we export the depth of the water from the stream as an hourly timeseries, then create a multiplier from that timeseries where depths above the critical level are given a multiplier of 1 and depths below the critical level are given a value of 0. The new multiplier timeseries is then multiplied by the input direct deposit timeseries to create a filtered input timeseries for HSPF. Thus, we can represent the animals being physically removed from the stream when the flow drops.
The flow stagnation volume was first implemented in the Beaver Creek TMDL in 2005 and has been used in all subsequent TMDLs developed at or in conjunction with Biological Systems Engineering at Virginia Tech.
The stage cutoff method was first used in the Mossy Creek & Long Glade Run TMDL, and subsequently used in the Beaver Creek, Lick Creek, and Old Womans Creek TMDLs completed under my direction. It's also been used in some TMDLs developed by my peers at Virginia Tech. Unlike the flow stagnation, which is a physical representation I feel confident is applicable everywhere, I evaluate the need for the behavioral representation (i.e., the cutoff) on a case-by-case basis during water quality calibration.
I've now set the backdrop for the current conundrum I'm facing with low flows in my current project...but I think this post is long enough for now, so I'll tell you all about it next week!
Friday, October 28, 2011
Friday, October 14, 2011
Comment on Bacteria Standards... and Biosolids Update
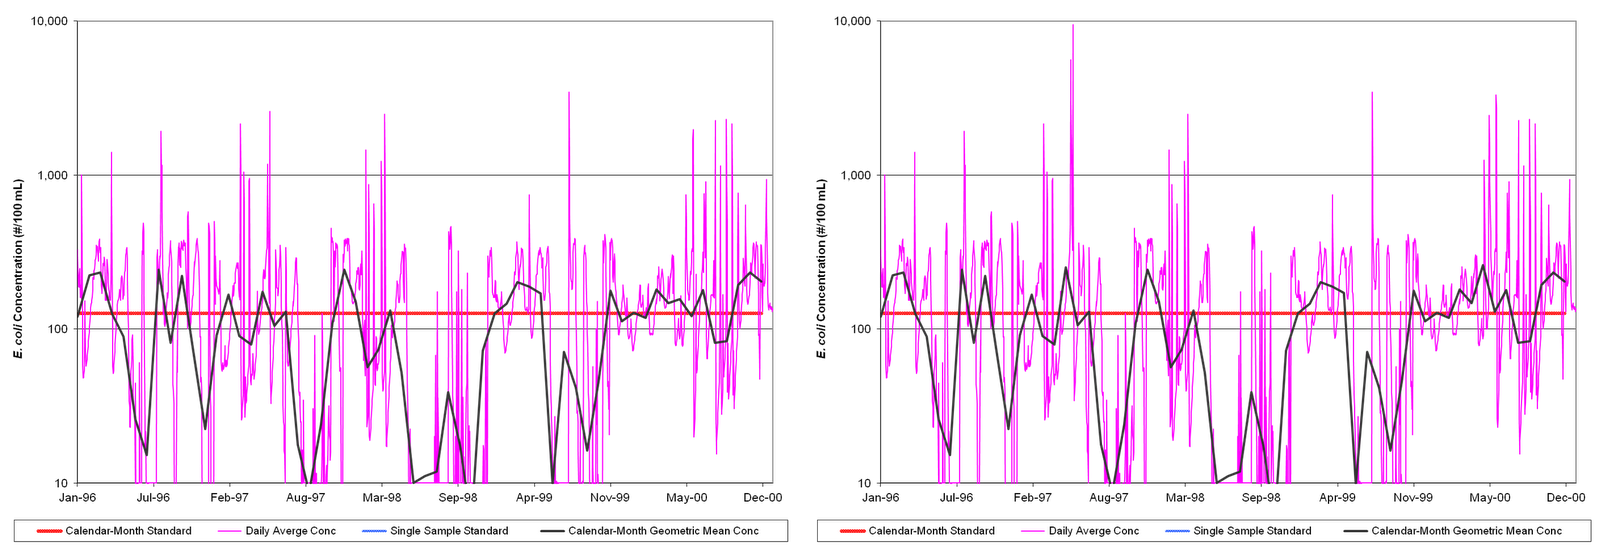
First, an update on the biosolids I wrote about last week. For my TMDL allocation scenarios, which are modeling scenarios attempting to determine the amount of pollution the water body can receive without violating standards, I set the applied load at the maximum permitted for Class B biosolids - 2,000,000 cfu/g. As I mentioned previously, I assumed a 90% loss in bacteria available for transport by surface runoff due to incorporation of biosolids within 6 hours of application. The results of this addition were not bad. In a 5-year period - with 5 biosolids application events - there were only two noticeable impacts on the bacteria concentration - can you see them in the figure below? The image on the left is without biosolids, and on the right is with biosolids. The pink line is the daily average E. coli concentration, and the black line is the calendar-month geometric mean E. coli concentration.
Overall this only added a handful of violations of the instantaneous criterion and no violations of the geometric mean criterion (red line) included in the standard for E. coli concentrations in Virginia (9VAC25-260-170). Which brings me to my second point in just a second... but first, as a general conclusion, the isolated responses shown by including biosolids were from particularly high storms in the months following application and overall did not have a large impact on modeling. Given the changes in the standard, it would appear at first glance that inclusion of biosolids at their permitted limits in the TMDL wouldn't be too difficult.
Now, the bacteria standard! 9VAC25-260-170 states that:
"The following bacteria criteria (colony forming units (CFU)/100 ml) shall apply to protect primary contact recreational uses in surface waters ...
E.coli bacteria shall not exceed a monthly geometric mean of 126 CFU/100 ml in freshwater.
...
2. Geometric means shall be calculated using all data collected during any calendar month with
a minimum of four weekly samples.
3. If there are insufficient data to calculate monthly geometric means in freshwater, no more
than 10% of the total samples in the assessment period shall exceed 235 E.coli CFU/100 ml ..."
This is more or less the same as it has always been since the switch from fecal coliform to E. coli as the indicator bacteria of choice several years ago at the urging of EPA, though at this point the Commonwealth has collected enough samples to drop the 'interim fecal coliform criteria' that were in effect until the full transition had been made. However, at long last DEQ has changed the way they require this standard to be met as part of the TMDL.
Previously, an acceptable TMDL had to have zero violations of both the geometric mean and the instantaneous (item 3 above) criteria. This is in stark contrast to the standard, which allows a 10% violation of the instantaneous criteria. As a result of this requirement, we often had to call for near-100% reductions in anthropogenic sources of bacteria - including livestock using streams for drinking water, runoff from pastures, pet waste, and failing septic systems - as well as reductions in wildlife contributions (and just how were we supposed to tell the wildlife to start using a toilet?!). This was often the only way for the model to show that there would never be a violation of the instantaneous criterion - and these reductions were often driven to extremes by a single storm event. Now, the very large issue of modeling uncertainty aside, the standard allows for a 10% violation of the criterion. My colleagues at Virginia Tech and I argued for years that we should be allowed to show a 10% violation of the criterion to match the standard.
The great news is that the Department of Environmental Quality has finally agreed with us! We can now allow a 10% violation of the instantaneous standard during modeling and still have a successful TMDL scenario. This means that we will be able to come up with much more reasonable reductions that will - hopefully - appear achievable to the watershed stakeholders. Our concern previously was that, when presented with 99-100% reductions in all bacteria sources in a watershed, the stakeholders would just give up as the goal was completely unattainable. Hopefully, seeing reductions more on the order of magnitude of 50% now, they will feel that they can really make a difference in the water quality of their local streams.
Friday, October 7, 2011
Biosolids and HSPF
Recently some of the folks I work with at Virginia Tech were contacted by the Virginia Department of Environmental Quality about modeling for biosolids. I was invited to participate in the discussion.
Biosolids pose an interesting modeling and stakeholder relations problem. They can of course have all sorts of nutrients, chemicals, metals, and of course are chock full of organic matter, but when one is developing a bacteria TMDL, these issues aren't relevant. It seems that there is some disagreement in the scientific field about the actual issues in properly treated biosolids, but that aside, it can be difficult to convince stakeholders to focus solely on the bacteria concerns related to biosolids when developing the bacteria TMDL. Other issues, if they do exist, would be addressed through the normal complaint process or perhaps in a TMDL for another pollutant. And of course if the biosolids AREN'T properly treated and applied, that opens a whole other can of worms I'm not going to consider today...
From a modeling standpoint, biosolids are difficult because their bacteria concentrations can vary quite a bit, but based on the sampling records I've seen, are almost always orders of magnitude below the standard in Virginia - 2,000,000 cfu/gram. In addition, although manure used as a fertilizer may or may not be incorporated into the soil after application, regulations specify that land-applied biosolids MUST be incorporated into the soil within 6 hours of application. This means that whatever bacteria are present in the biosolids are less available to transport by surface runoff.
To top it all off, the fields I've seen in Virginia that receive biosolids do so on a rather sporadic basis - typically the same field will not receive application every year - it will receive it once every 3 years at best. In the area I'm working with, most of the fields are 'backup' fields that are only used if all other fields available to the biosolids company have been exhausted. Additionally the area of cropland that receives biosolids is typically much smaller than the cropland in a given sub-watershed - the finest scale we typically look at in modeling. The 'standard' method of land loading used in the HSPF model is to use a load per acre per day - averaging the once every three years to a small part of the cropland area application to a load/acre/day would be completely unrepresentative of the potential impact of the concentrated application that occurs.
And finally, the biosolids, on their one day of application every three years, typically produce a significantly higher bacteria load than normally experienced by the cropland to which they're applied. Because the die-off on the land surface in HSPF is specified not as a rate but as a limit on the accumulation of the pollutant on the land surface, this raises questions on how to represent the die-off of bacteria in biosolids in HSPF.
The technique I've been using for this TMDL - using HSPF - is to represent the bacteria in biosolids as dry atmospheric deposition of a second quality constituent (where the first quality constituent is the bucket I normally use for bacteria). Representing the bacteria in biosolids as atmospheric deposition addresses the issue of application timing, and representing the bacteria in biosolids as a second quality constituent allows me to uniquely apply the biosolids to a small area of cropland without having to create an additional pervious land segment operation (this could be beneficial if one is approaching the limit on operations enforced by HSPF).
Technical gobbledygook follows... This is done by setting NQUALS to 2 for the relevant cropland PLS, setting QSOFG to 2, setting PQADFG to -1, inputting a MUTSIN timeseries with application on the appropriate dates as PQADFX through the NETWORK block, creating a new, smaller area entry for the relevant cropland PLS in the SCHEMATIC block, and using a new MASS-LINK table with that smaller area entry to that routes ONLY the second QUAL to the general bacteria bucket in the receiving RCHRES (don't want to route the first QUAL or water as they would be double-counted). I assume a 90% reduction in bacteria available to transport in surface runoff before creating the PQADFX timeseries.
To address the die-off problem, and here you really should read the "Accumulate and Remove by a Constant Unit Rate and by Overland Flow" section of the HSPF Manual, it turns out that the limit on surface accumulation (SQOLIM) doesn't actually chop things off - it is used as a ratio with the daily loading (ACQOP) to set a die-off rate. Now, the problem with this of course is that you want ACQOP to be zero - you don't want a daily loading, you only want a loading on the days when biosolids are applied. But if you set the daily loading to something like 1 or even 100 cfu/acre, this is completely insignificant compared even to the wildlife loading. So that makes your denominator in the die-off ratio non-zero. Because SQOLIM is NOT actually the limit on surface accumulation but is instead used as a ratio with ACQOP to set a die-off rate, simply set SQOLIM to be a multiple of your small ACQOP - I used 9*ACQOP to match what we use to calculate die-off for all our other bacteria on the land surface, but you can read up elsewhere (Appendix C) on how you might set an appropriate value. SQOLIM will be much much smaller than the actual load the land is receiving from biosolids, but that is okay. So far this is working well.
The final task will be representing the biosolids during allocation at an appropriate level. To be uniform with our representation of typical permitted operations (e.g., NPDES direct dischargers), we should model the application at the permitted level - the 2,000,000 cfu/gram that is rarely seen in real life. I'm planning to try this out, using the permitted level, in the next week or two as I develop allocation scenario for the TMDL I'm working on. I'll let you know how it goes...
Subscribe to:
Posts (Atom)