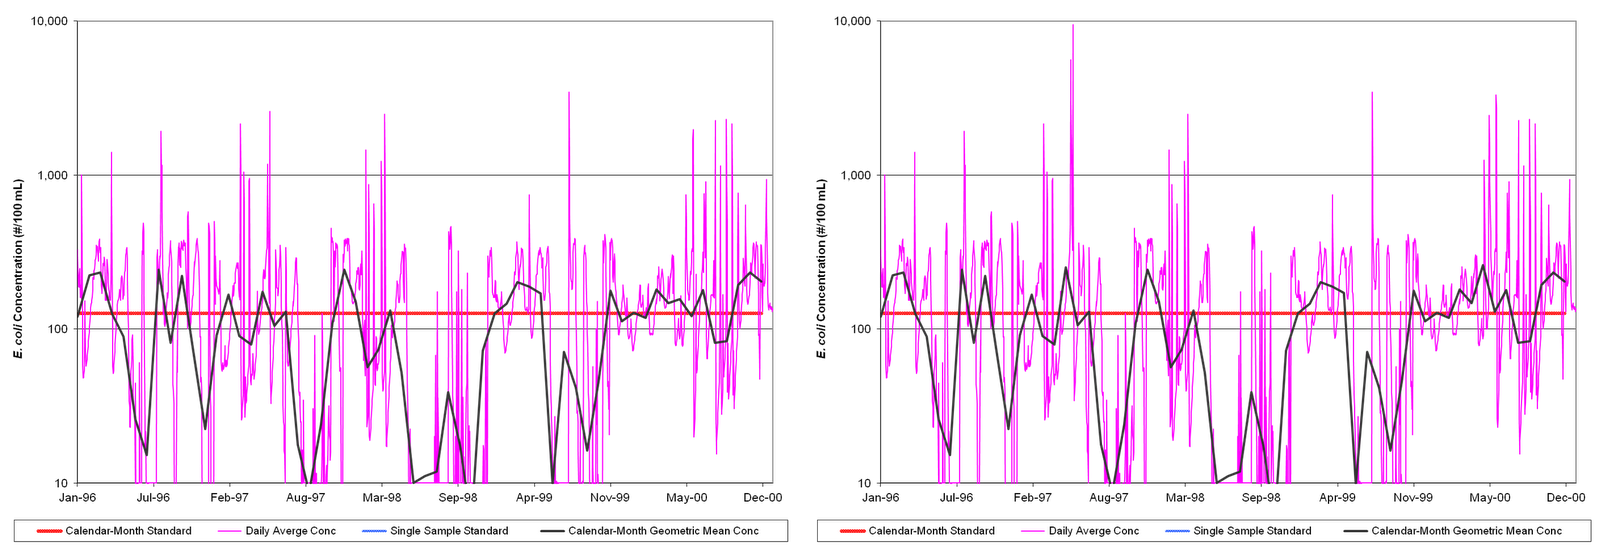
Overall this only added a handful of violations of the instantaneous criterion and no violations of the geometric mean criterion (red line) included in the standard for E. coli concentrations in Virginia (9VAC25-260-170). Which brings me to my second point in just a second... but first, as a general conclusion, the isolated responses shown by including biosolids were from particularly high storms in the months following application and overall did not have a large impact on modeling. Given the changes in the standard, it would appear at first glance that inclusion of biosolids at their permitted limits in the TMDL wouldn't be too difficult.
Now, the bacteria standard! 9VAC25-260-170 states that:
"The following bacteria criteria (colony forming units (CFU)/100 ml) shall apply to protect primary contact recreational uses in surface waters ...
E.coli bacteria shall not exceed a monthly geometric mean of 126 CFU/100 ml in freshwater.
...
2. Geometric means shall be calculated using all data collected during any calendar month with
a minimum of four weekly samples.
3. If there are insufficient data to calculate monthly geometric means in freshwater, no more
than 10% of the total samples in the assessment period shall exceed 235 E.coli CFU/100 ml ..."
This is more or less the same as it has always been since the switch from fecal coliform to E. coli as the indicator bacteria of choice several years ago at the urging of EPA, though at this point the Commonwealth has collected enough samples to drop the 'interim fecal coliform criteria' that were in effect until the full transition had been made. However, at long last DEQ has changed the way they require this standard to be met as part of the TMDL.
Previously, an acceptable TMDL had to have zero violations of both the geometric mean and the instantaneous (item 3 above) criteria. This is in stark contrast to the standard, which allows a 10% violation of the instantaneous criteria. As a result of this requirement, we often had to call for near-100% reductions in anthropogenic sources of bacteria - including livestock using streams for drinking water, runoff from pastures, pet waste, and failing septic systems - as well as reductions in wildlife contributions (and just how were we supposed to tell the wildlife to start using a toilet?!). This was often the only way for the model to show that there would never be a violation of the instantaneous criterion - and these reductions were often driven to extremes by a single storm event. Now, the very large issue of modeling uncertainty aside, the standard allows for a 10% violation of the criterion. My colleagues at Virginia Tech and I argued for years that we should be allowed to show a 10% violation of the criterion to match the standard.
The great news is that the Department of Environmental Quality has finally agreed with us! We can now allow a 10% violation of the instantaneous standard during modeling and still have a successful TMDL scenario. This means that we will be able to come up with much more reasonable reductions that will - hopefully - appear achievable to the watershed stakeholders. Our concern previously was that, when presented with 99-100% reductions in all bacteria sources in a watershed, the stakeholders would just give up as the goal was completely unattainable. Hopefully, seeing reductions more on the order of magnitude of 50% now, they will feel that they can really make a difference in the water quality of their local streams.
No comments:
Post a Comment